
How to analyse stocks?
Applying the 8-criteria framework

Introduction
My first stock analysis was airtight: I invested in brands I'd heard of, because familiarity is basically a moat. For the quants in the room, I also pulled up the stock chart (up was good, down was bad) and checked whether revenues were growing, which I'm told is generally preferred. The CFA Institute has since reached out to feature me in their curriculum.
Over many years I fine-tuned my approach to stock analysis, lost money, learned why, and rebuilt from there.
What follows is the framework I wish I'd had at the start: structured enough to be rigorous, simple enough to actually use.
The checklist
With over 40,000 listed companies to choose from, you need a filter first. Mine is quality. Quality companies tend to hold up when markets get ugly, compound steadily when they don't, and rarely surprise you in a negative way.
The 8-criteria framework helps me filter the good from the bad and straight up ugly:
Sustainable business model
Strong balance sheet
Highly profitable
Great capital allocation opportunities
Capital light model
Competitive advantage
Experienced management with skin in the game
Supported by a strong outlook
Each criterion tells part of the story. Together, they tell you whether a company is worth your time.
I review the target company on each criterion and decide whether it passes the bar, requires caution, or fails. This gives me a clear picture of where a company is strong, where it needs watching, and where it falls short.
Valuation plays a critical role when deciding to invest or remain on the sidelines. I leave it out deliberately. Business quality and price are separate questions.
1. Sustainable business model
I want to position myself as well as possible to assess an investment opportunity. The starting point is to understand the business itself and its underlying mechanics.
Concretely, I try to answer the following questions:
Can the company generate sustainable revenues?
What products do they sell and how does that affect revenue quality and stability?
How does the company position itself and which parts of the value chain do they cover?
How does the business model impact the margin dynamics?
This week I was reminded of why analysing the business model matters:
I am currently writing a deep dive on Interparfums. The business model is asset-light and license-based, leading to specific advantages for the company, but also concentration risk.
By analysing the business model, I am able to better understand how strong the business actually is, and to not underestimate the potential risks.
Even the best investors focused on getting the basics right. Warren Buffett explained that he prefers to invest in businesses he understands, and called it his “circle of competence”.
“The important thing is not how big your circle is, but knowing where its boundaries are.” - Warren Buffett
Would you lend $10k to someone without knowing what they needed it for or how they'd pay you back? Probably not. So why would you invest in a company without understanding how it actually makes money?
2. Strong balance sheet
“Never invest in a company without understanding its finances. The biggest losses in stocks come from companies with poor balance sheets.” - Peter Lynch
The balance sheet is the anchor of a company. I prefer to own companies that have none or a limited amount of net debt (less than 2x EBITDA).
The reason why we look for companies with manageable debt burdens is because they need the financial flexibility to execute their growth initiatives.
Goodwill deserves special attention. When a company acquires another business and pays more than the book value of its assets, the excess lands on the balance sheet as goodwill. It sits there quietly, until it doesn’t. If the acquired business underperforms, the company must write down the value, absorbing a one-time non-cash impairment charge. These charges are often large, always unwelcome, and a sign that management overpaid.
The size of the goodwill position tells you how much acquisition risk is embedded in the balance sheet. As a rule of thumb, I'm cautious when goodwill exceeds 20% of total assets. At that level, a meaningful impairment can materially damage the balance sheet.
Let’s make it tangible with an example.
Bpost is the Belgian postal service. Their postal volumes are in decline for years, and the package delivery segment is experiencing tepid growth and very strong competition.
In light of these developments the company decided to acquire Staci, a leading logistics player. This new segment is supposed to compensate for the declining postal segment, and more.
Today, Bpost has a net debt position of
€1.8bn, stretching to 3.2x EBITDA. Interest payments are eating up operating profit. The new segment is not delivering as expected, and 2026 will likely be a pivotal year for the company.Hanging above it all is a very sizeable goodwill position, as a result of the Staci acquisition.
This situation was completely avoidable. The warning signs were always there and visible to anyone who knew where to look.
A balance sheet also provides a snapshot of liquidity. This is the company’s ability to meet its obligations in the near term. One of the more reliable ways to measure this is the Operating Cash Flow Ratio, which divides the cash generated from operations by current liabilities. Unlike purely accounting-based measures, it cuts through accruals and tells you whether the business is generating enough real cash to cover what it owes in the short run. I want this ratio to be above 1, meaning operating cash flow fully covers current liabilities.
As highlighted in the example, a company should be able to easily cover its interest payments. If not, it again limits flexibility as the company is not capable to make new investments. This in turn hinders the company to grow. I look for a coverage ratio through EBIT of 8x. This gives me comfort that interest payments won't crowd out reinvestment.
Lastly, a company must be able to repay its debt. The metric I use here is the FCF-to-Net Debt ratio. For FCF, I use cash from operations minus capital expenditures, but before dividends. Dividends are a discretionary decision by management; what I want to isolate is the raw cash-generating power of the business, independent of how it chooses to distribute capital.
A ratio above 20% means the company could theoretically retire all its debt within five years using only its own cash.
Key metrics
Operating Cash Flow Ratio above 1 (Operating cash flow / Current Liabilities)
Goodwill share below 20% (Goodwill / Total assets)
Interest coverage above 8x (EBIT / Interest expense)
FCF to Total Debt above 20% (FCF / Total Debt)
3. Profitability
It surprises me time and time again that investors pick up companies that have not made $1 in profit, or show irregular net profit margins. How is that company supposed to grow and defend its competitive advantage?
First, I check the gross margin. This will tell me how profitable production actually is. If it increases over time, we are likely looking at a company with pricing power or an ability to produce cheaper, and therefore has a competitive advantage.
We generally look for gross margins above 40%. But again, this can differ per sector. Supermarkets for example have much lower gross margins.
The second margin we are interested in is the net profit margin. This tells us what is left at the bottom line on paper.
We want margins to be as high as possible as it provides resources for the company to expand the business and reinvest to become more competitive. Net profit margins above 10% are considered healthy.
Being profitable on paper is great. It makes your reports look shiny and keeps the accountants happy. But you can only pay your bills with cold hard cash.
That’s where FCF comes in. It tells you how much cash the business is spitting out after paying for the stuff it needs to maintain operations.
If the business is turning at least 80% of its accounting profit into real cash, we’re ok. If it’s way lower than that, something’s off. This is a potential red flag for investors. Aggressive accounting, high working capital or high maintenance Capex could be a potential cause.
Let’s use an example to show how profit margins and FCF conversion tell a different story about the same company.
I used to own shares in PAX Global Technology, a Hong Kong-listed company that designs and manufactures electronic payment terminals. On paper, FY24 looked perfectly healthy, with gross and net profit margins at 47% and 12%.
Let’s look at cash flow conversion. Three of the last four years failed the 80% threshold badly. From 0.3% in FY21, to 25% and 24% during FY22 and FY23. FCF conversion recovered strongly in FY24, reaching 145%, driven by inventory releases rather than a fundamental improvement in the business.
This did not give me confidence at all. The main culprit was working capital. As a manufacturer, the company was building up inventory, but mostly off-cycle, meaning demand did not absorb inventory accordingly. PAX also extended generous credit terms to large customers, delaying cash collection.
The result is a company that performs well on paper, but which has structural operational issues. I was glad to identify this issue, and offloaded the shares. This is exactly what the framework is designed to catch.
Key metrics
Gross margins above 40% ((Revenues - Cost of Goods Sold (COGS)) / Revenues * 100)
Net profit margin above 10% ((Net profit / Revenues) * 100)
FCF conversion above 80% (FCF / Net income)
4. Capital allocation
What actually happens with that net profit a company makes? It only ends up on your bank account if a company pays out a dividend. These are nice to have, but that money cannot be reinvested by the company to foster growth.
Another way management can spend the hard-earned profits is to buy back shares. This indirectly increases per share earnings. It is an opportunistic method to create shareholder value when the stock price is below the company’s intrinsic value.
PayPal is supercharging EPS. Here is their diluted EPS growth and shares outstanding over the past five years. The company has been buying back shares at a rapid pace:
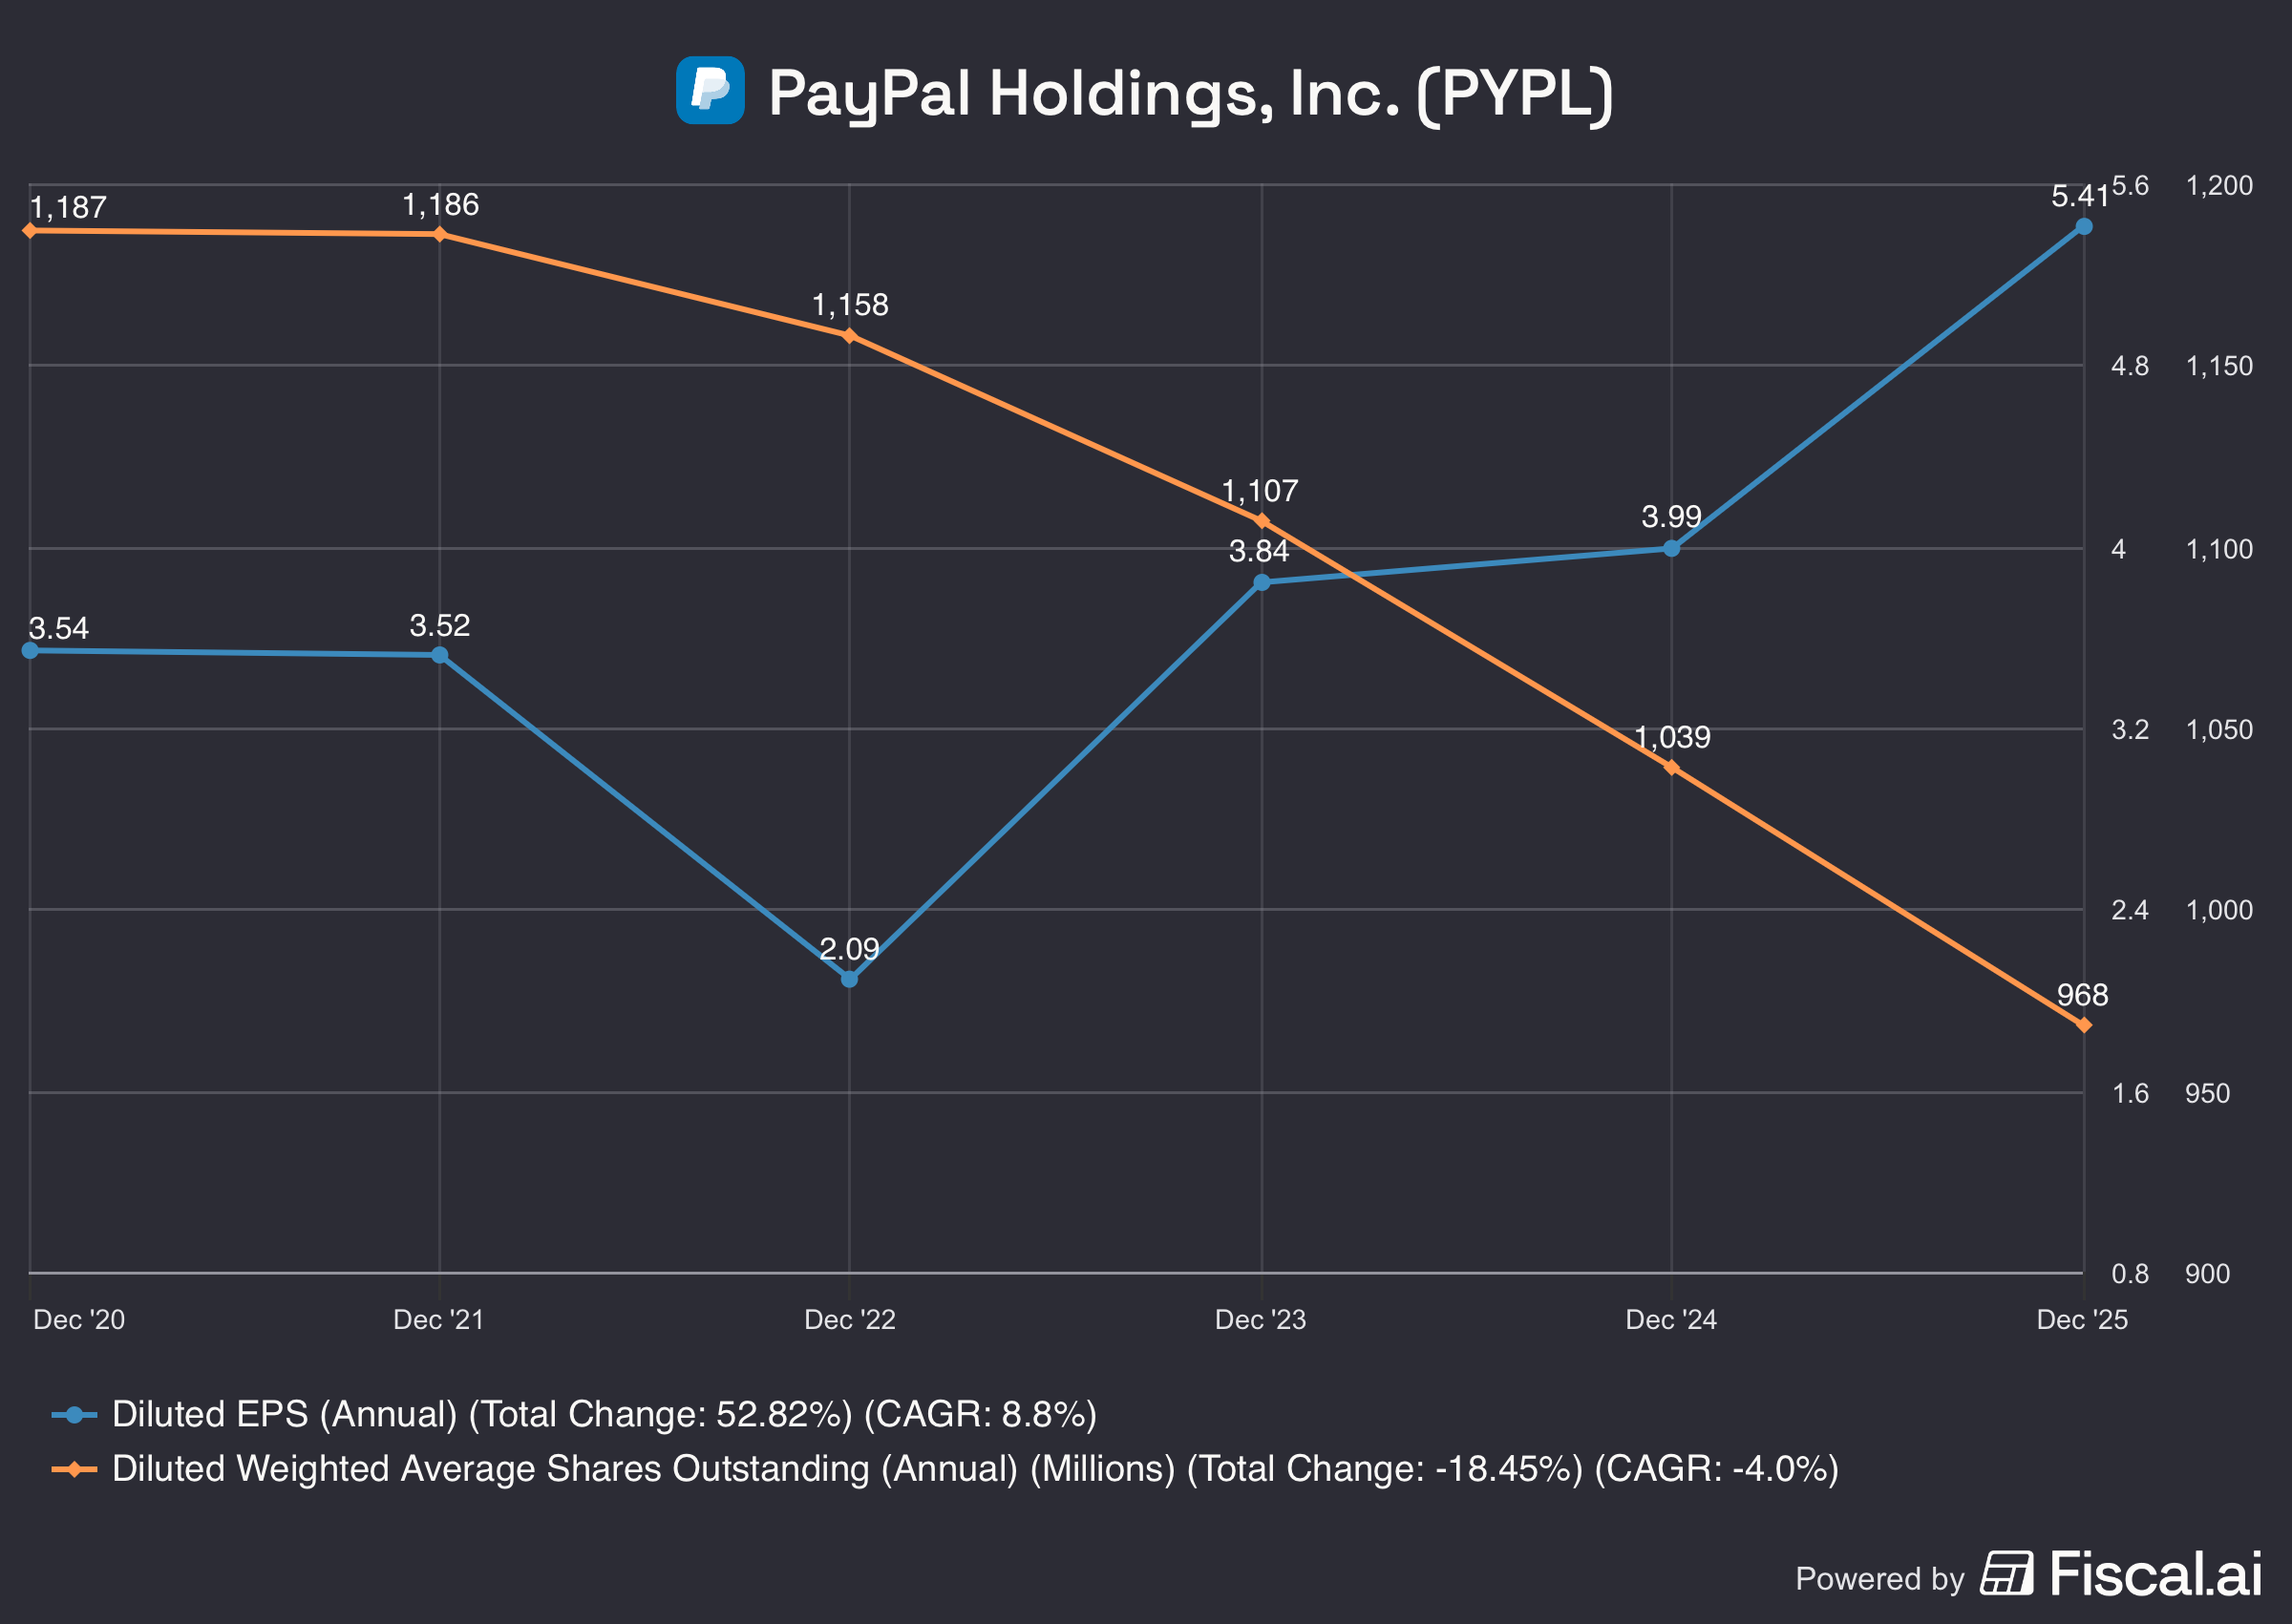
A third way for management to deploy cash is to reinvest (my preferred use of capital). Companies that are able to invest at attractive rates of return will make shareholders happy over the long term.
"The ability to allocate capital is the most important skill a CEO can have." - Henry Singleton
We can check whether capital is allocated properly by reviewing Return on Invested Capital (ROIC). This tracks how much return a company generates for every dollar it invests. Remember, the return on investment is a critical aspect of any investment thesis. It allows a company to grow its earnings, which in turn supports a stock price over the long term.
If the ROIC declines over time, it implies that the investment opportunities are becoming less attractive. For most businesses, the cost of capital sits between 8–10%. A ROIC of 20% means the company is generating twice the return required.
Key metrics
ROIC above 20% (Net Operating Profit After Tax / (Total Equity + Total debt))

For simplicity, we use total equity plus total debt as the denominator. In practice, excess cash should be deducted, as it is not actively deployed capital.
5. Capital intensity
“We still love a business that takes very little capital and earns high returns, and continues to grow, and requires very little incremental capital.” - Warren Buffett
Capital intensity indicates how much a company must spend on physical assets just to operate. When this number is high, the business becomes less flexible financially and slower to react to changing conditions.
It also reduces profitability because a big share of earnings must be reinvested into equipment and infrastructure instead of going to shareholders or new investment opportunities.
And since these costs don’t disappear in a downturn, capital-intensive companies face more financial risk, higher debt, and greater earnings volatility.
But, not all capital expenditures are the same. You have the expenditures that are needed to keep the business running. This is reflected by Maintenance Capex (depreciation & amortisation). All other Capex can be considered growth Capex. We do not see this as an issue, as it potentially fosters earnings growth in the future.
Visa is a capital light business. Its Maintenance Capex continuously eats up approximately 3% of total revenues. The company does not require inventory, nor physical branches. The compounding effect of doing more and more transactions with similar infrastructure allows the company to reduce Maintenance Capex relative to revenues over time.
On the other side of the spectrum we have e.g., ArcelorMittal. The steel mill must replace furnaces, maintain equipment, and invest constantly just to produce the same tonnage. Maintenance to Capex is 4-5%.
Visa’s Maintenance Capex is mostly software, technology infrastructure, and amortisation of acquired intangibles. Visa generates roughly $40bn in revenue with almost no physical plant, while ArcelorMittal needs ~$60bn in heavy industrial assets to produce its revenue. That's precisely the capital-light, high-return business Buffett was describing.
We want Maintenance Capex to revenues to stay below 5%. If a company must spend more than 5 cents of every dollar it generates just to maintain its asset base, a meaningful share of the business's output is being consumed before it reaches shareholders.
The target is also to keep Capex to cash from operating activities below 25%. This allows the company to allocate a significant portion of available capital for growth investments, debt repayments and dividends.
Key metrics
Maintenance Capex intensity below 5% (Depreciation & amortisation / Total revenues)
Maintenance Capex intensity below 25% (Depreciation & amortisation / Cash from operating activities)

D&A is typically lower than total capex, so this is a deliberately conservative screen. Businesses that fail it are signalling a structurally heavy asset base.
6. Competitive advantage
Think of your competitive advantage (moat) as the water and wall around a castle. It protects you from others stealing your market share. Simultaneously it allows you to maintain pricing power.
A strong moat is what separates a good business from a great investment. It keeps competitors out, protects pricing power, and is the reason some companies compound returns for decades while others plateau.
I started a position in Kaspi, a Kazakhstan-based company. They operate a Super App in Kazakhstan that connects consumers and merchants across three interlocking platforms: payments, marketplace and fintech. This makes for a very powerful flywheel.
This has allowed them to build a quasi-monopoly position. Every vertical they launch (car sales, travel, smart phones) sees instant scaling and healthy growth.
Eventually this moat will be under fire (e.g., through regulatory changes), but until then Kaspi can expand and fortify their moat.
Kaspi’s example shows that a strong and durable moat matters. They hold pricing power, driven by a network effect.
It is critical that you understand the moat (Is it network effect, scarce resource, switching costs, etc.?). Oftentimes, investors underestimate the moat of a company, or they misinterpret it altogether. Misidentifying a cyclical pricing advantage as a structural moat is the most common error. The moat depth and durability is pivotal to your investment thesis.
A relevant metric to get a view on competitive advantage is gross margin and ROIC. Strong gross margins can indicate pricing power, with high ROIC indicating that a company is by definition protected against competitors (if competitors could freely enter, returns on capital would be competed down over time.).
7. Management
“I try to buy stock in businesses that are so wonderful that an idiot can run them. Because sooner or later, one will.” - Warren Buffett
The quality of a company’s management team is crucial. Strong leadership determines how effectively an organisation uses its resources, handles challenges, and protects shareholder value.
Another key factor to look for in management is their financial incentive to perform. If executives aren’t personally invested in the company, or if their compensation isn’t tied to creating shareholder value, why would they be motivated?
This is why it’s always important to check insider ownership. It shows how financially aligned management is with shareholders, and how much confidence they have in the company’s future. The best examples are companiess that are founder-led. They treat their companies like their own child. Just look at Bernard Arnault at LVMH, or until recently Mark Leonard at Constellation Software. Both companies avoid shareholder dilution and have performed extremely well.
Key metrics
Insider ownership above 10% (Shares owned by insiders / Total shares outstanding)
8. Outlook
Investing in companies riding strong secular trends works because these businesses grow with long-term forces that steadily push demand higher, regardless of short-term market swings.
They benefit from structural shifts, like aging populations, digitalisation, or clean energy.
Because their markets keep expanding, these companies can scale faster, compound earnings longer, and recover more easily from setbacks.
In short, secular trends give you growth that’s durable, predictable, and harder to disrupt, making them some of the best long-term investments.
Landing the plane
Analysing a stock is hard work. But, with a structured approach you will save yourself a lot of time, and you will identify potential risks you otherwise miss.
I use the 8-criteria framework as a guide. The underlying criteria tell me a story. You start with the business model because everything else depends on it. A business you don’t understand cannot be analysed, it can only be guessed at.
The balance sheet and profitability criteria tell you whether the business is financially sound today. Can it meet its obligations? Is it generating real cash, not just accounting profit?
Capital allocation and capital intensity tell you whether the business is built to compound. A profitable company that requires constant heavy investment to stay still is not a compounder. A profitable company that reinvests at high rates of return on minimal capital is.
The competitive advantage criterion asks whether any of this can last. Margins and returns are only valuable if they are defensible.
Management determines whether the advantage is actively protected or quietly eroded. Insider ownership tells you whether the people in charge are playing with their own money or yours.
Finally, reviewing the outlook will give insight into whether the company can take advantage of a growing underlying market. Even a great business in a shrinking market will eventually run out of runway.
Burn The Index
I will apply this framework very often when writing deep-dives about potential investment opportunities. If that sounds useful, you know where to find me!